 Dr. Masato Kajimoto is an Assistant Professor at the Journalism and Media Studies Centre at the University of Hong Kong. Masato specializes in news literacy education, multimedia storytelling, and social media in journalism. His MOOC, “Making Sense of News”, started on May 19, 2015.
I’ve recently finished teaching my first Massive Open Online Course (MOOC) on news literacy for the public on edX, the non-profit education portal founded by Harvard University and the Massachusetts Institute of Technology.
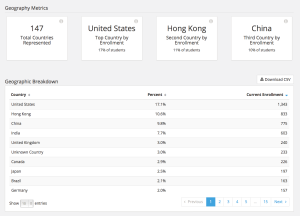
The six-week course, titled Making Sense of News, attracted thousands of students from 147 countries. It comprised 63 short lecture video clips (mostly between 2 to 4 minutes), exercises, readings, five graded assignments (two of which were peer-reviewed) and discussion forums (964 comment entries were made by the final week).
More than 7,500 students from all over the world signed up for the course.
The massive collection of students’ behavioral data aggregated at the end of the course made me realize the potential of online-based media education research.
The following blog post sketches out some of the many possibilities this emerging form of teaching and learning can be used.
The big data gathered through MOOCs, in my view, would shed light on certain elements that could have not been examined through the conventional research methods.
1. Correlations, correlations, correlations.
The MOOC provides an all-in-one platform for media education research whereby the researchers can gather everything — from entrance/exit surveys to demographic information to learning patterns (access time, clicking behaviors, etc) to the results of knowledge tests to commentaries in the class discussions (forums) to academic performance (assignment grades).
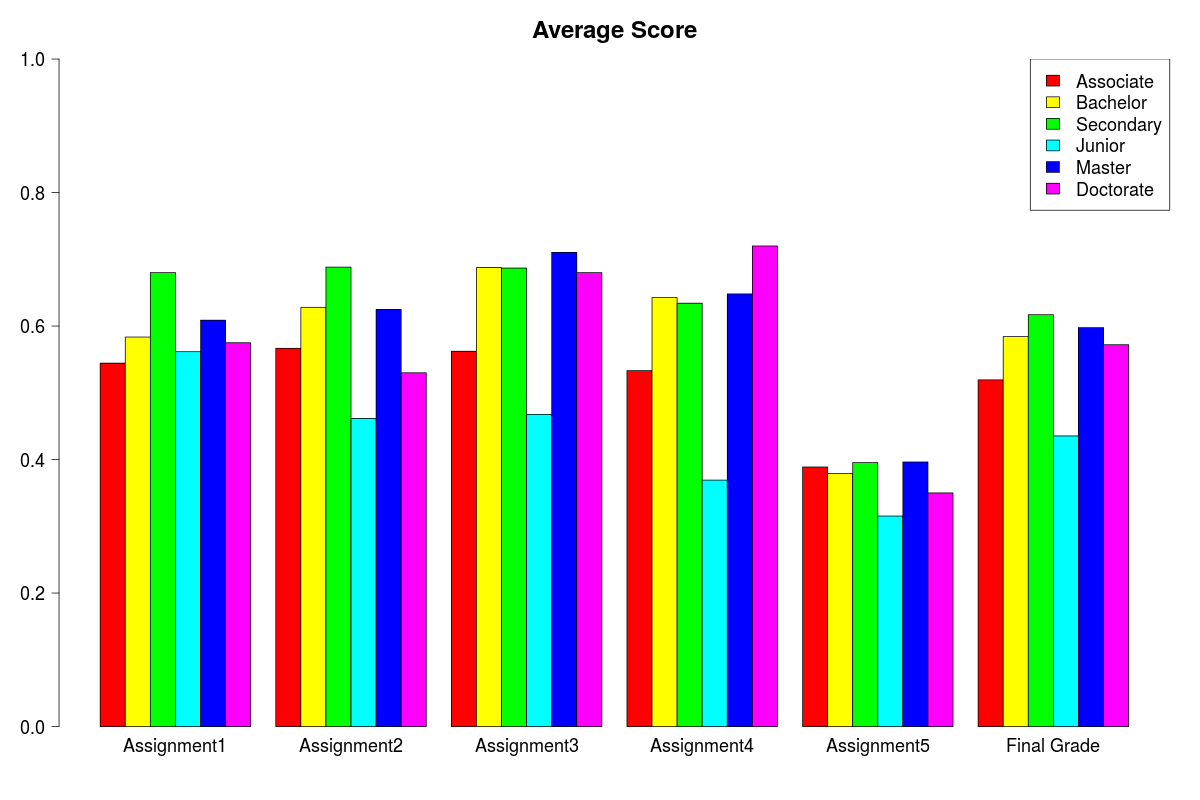
The data indicate that obtaining higher degrees do not necessarily make people smarter news consumers.
This gives the researchers the dataset that can be examined in a wide variety of ways to explore whether there is a correlation among different variables. For example, the relationships between two of the followings can be examined.
- Selected demographic variables
- News literacy skills (assessed by the assignment results)
- Frequency of forum posts
- Forum engagements
- Video playback patterns
- Click-through behaviors
2. Control group recruitment? A/B testing? Double-Blind test? Not so difficult.
The online platform makes it possible and easy to test different instructional designs, a variety of video-based communications and other pedagogical methods to teach news literacy.
For example, a researcher could produce two or three different instructional video clips with the same script – one with the instructor talking with his/her face shown, one with an avatar replacing the instructor’s face, and one with a professional TV talent taking the role of the instructor.
The three clips can be randomly assigned to different students. Later, the effectiveness of each clip could be measured by the results of quizzes that follow immediately after the video. Such A/B testing normally won’t work in a lab setting as standardizing the test-takers’ individual abilities would be next to impossible, but the whopping sample size that a MOOC can provide could possibly alleviate such concerns greatly.
With the same method, two different news articles can be given to the students with only one word changed. It would be interesting to see if the choice of one word over the other would affect the ways students detect and evaluate media biases. The possibilities of using the online platform for both teaching and research at the same time are limitless here.
3. Who is communicating with whom? Qualitative insights into the minds of students and their learning behaviors.
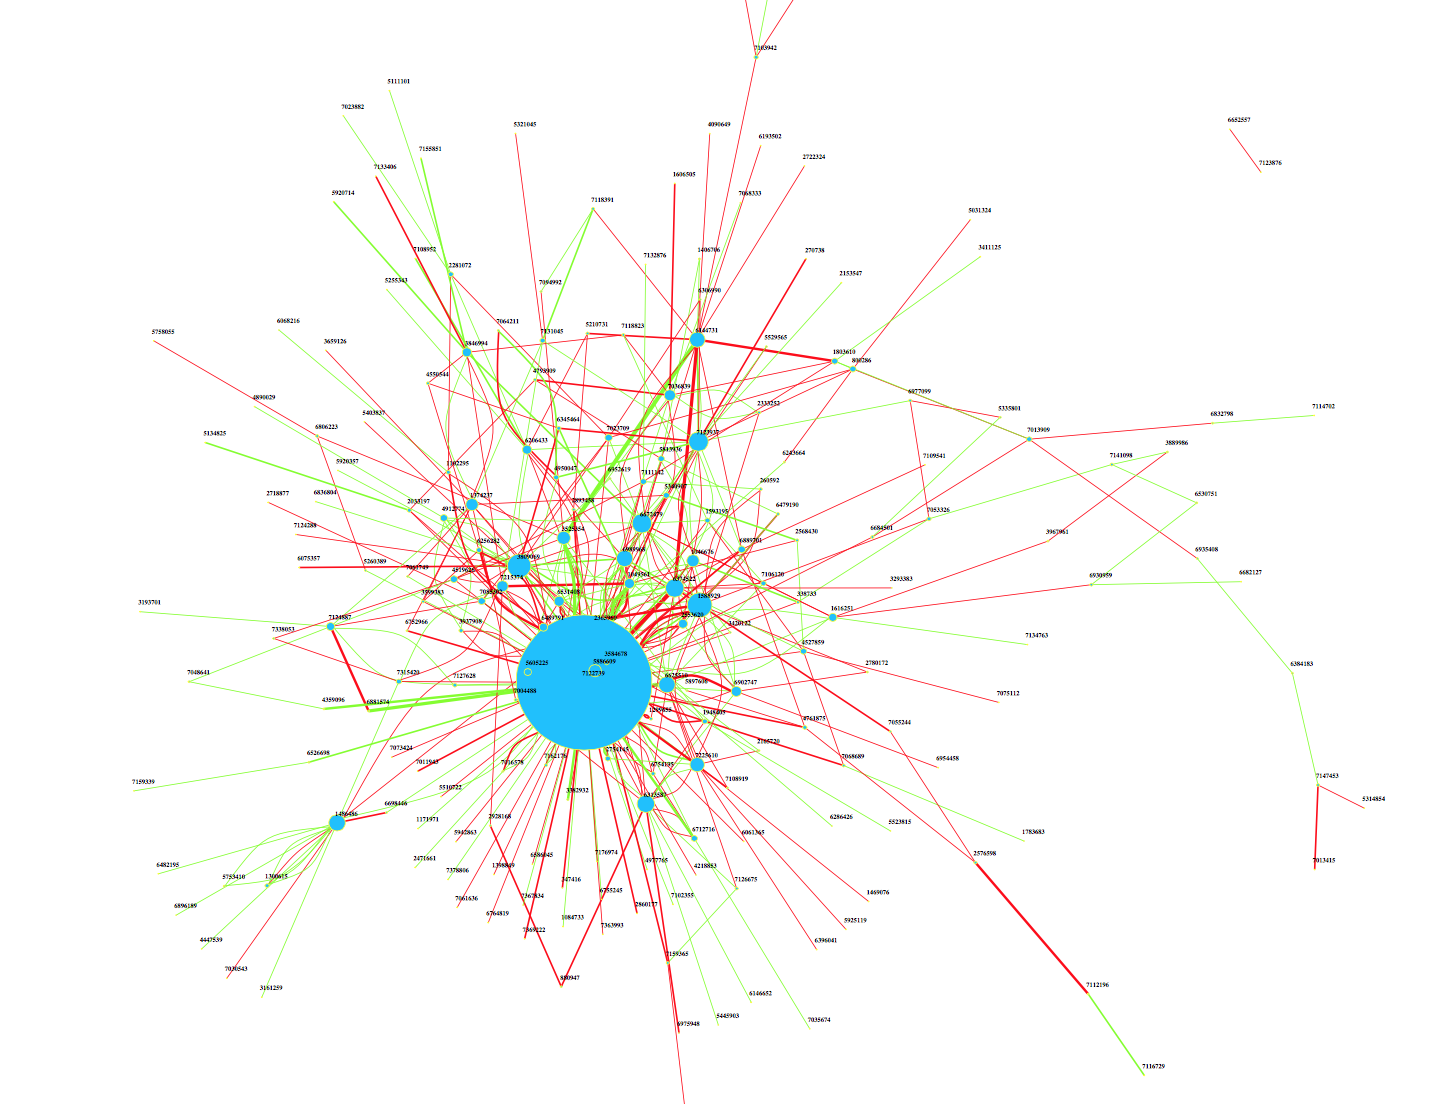
Every single communication can be mapped on MOOC.
The written communications among the students can be tracked down, mapped and combined with other variables, which could form a foundation for qualitative research.
The dataset allows researchers to see how each student engages with one another through peer-reviewed assessments and forum discussions easily.
Once certain patterns are identified, researchers can delve into the content of their written communication.
Say, for example, let’s suppose there are two clusters of engagements among high news literacy skill students (group A) and low news literacy skill students (group B) that were organically formed. If the data shows that they (the group A and B) are not communicating with each other, we can qualitatively analyze their digital conversations and possibly distinguish some key elements that might tell us why certain instruction works for some students and not others.
4. What works? What doesn’t? Improving our teaching.
The detailed video playback data reveals many things. For instance, the learning analytics system developed at Hong Kong University of Science and Technology called VisMOOC can let us visually see each video clip’s “forward seeks” and “backward seeks.”
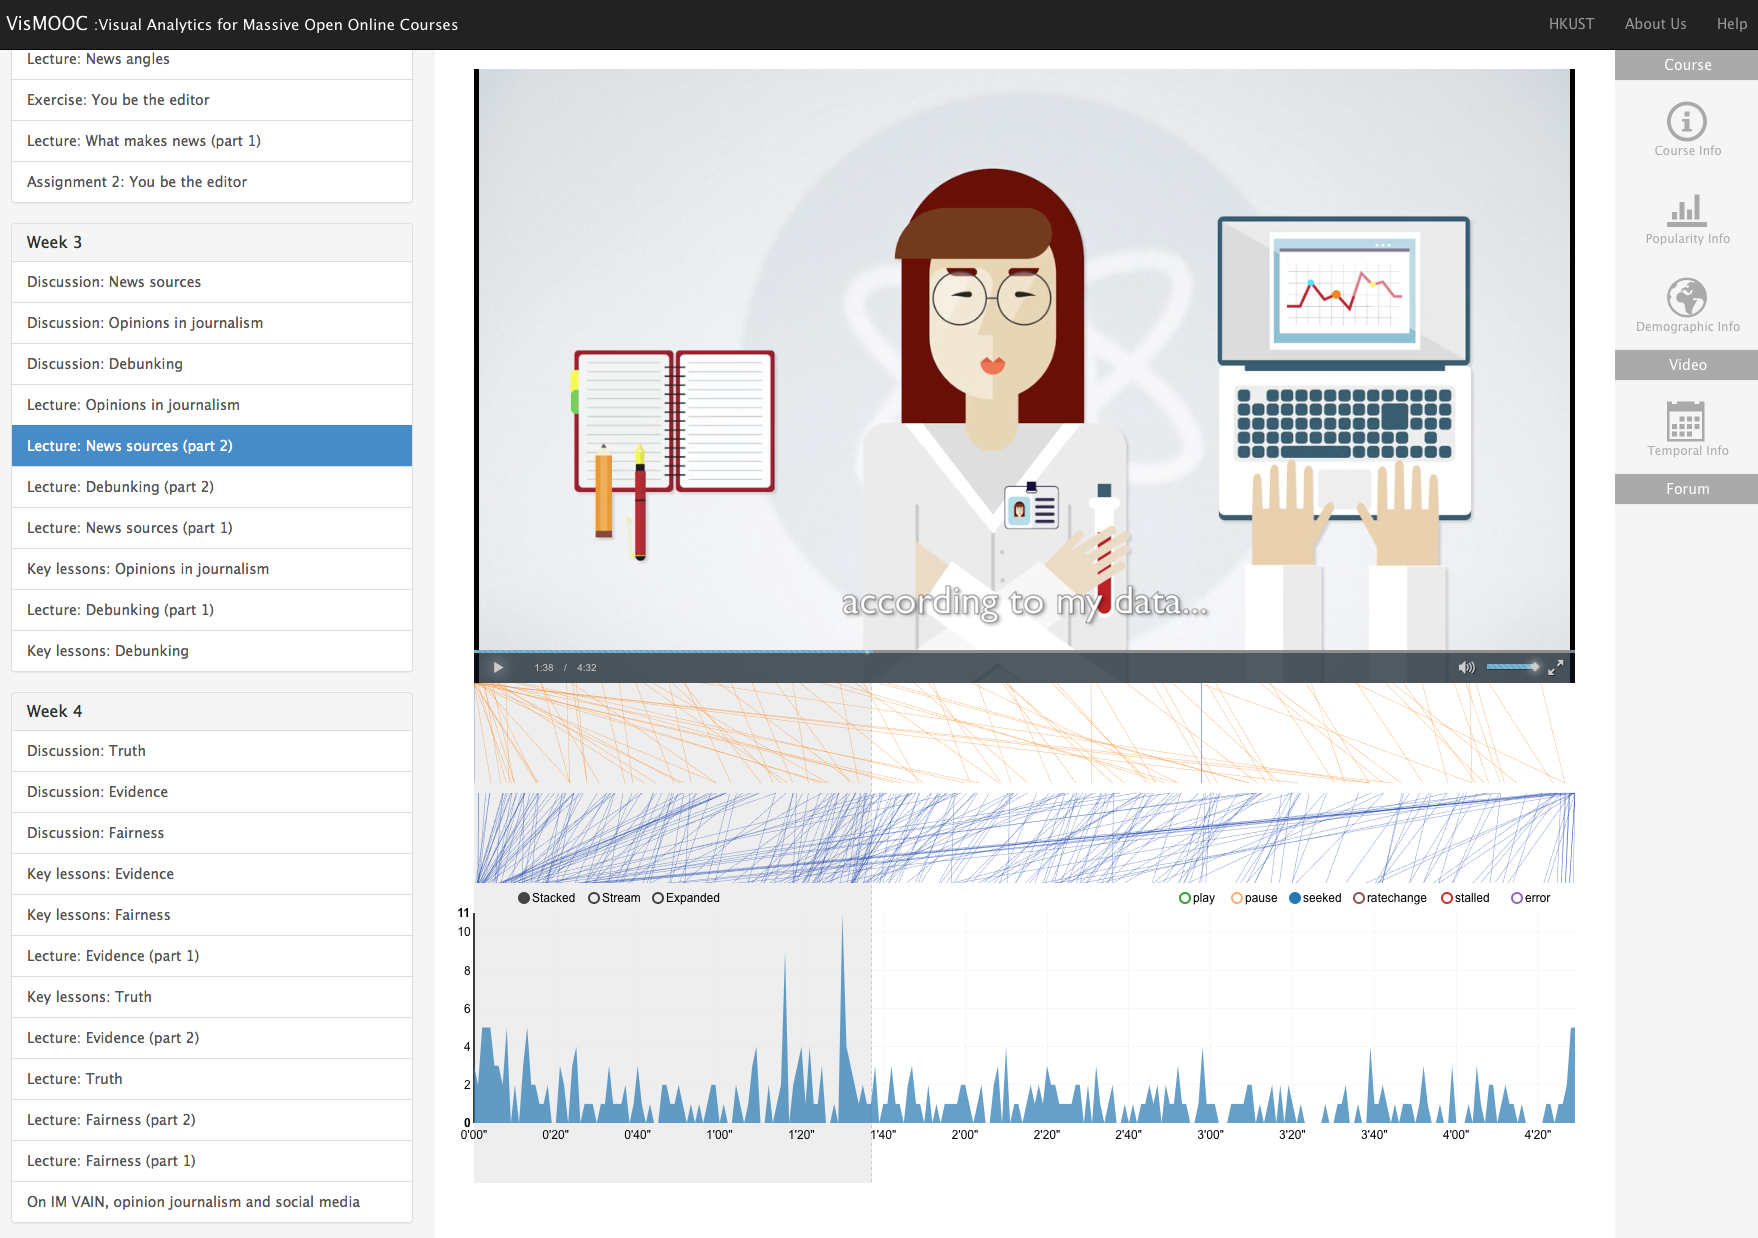
VisMOOC visualizes video playback data.
We could see the exact points where students paused, fast-forwarded and rewound the clip, which indicates not only how students interacted with the video lectures but also what visual cues disappeared too hastily for them (pause), which parts seemed to have been considered redundant or unnecessary (fast-forward or “forward seeks”), and what concepts and explanations were difficult to understand (rewind or “backward seeks”).
The click through data and other web analytics data also reveal many other factors that would inform us of the students’ learning: say, for instance, which reading assignments students tried to read (click), how much time students spent to complete different exercises and assignments, what time/day they accessed the teaching materials and so much more, all of which could provide valuable information for us to improve our teaching.
Possibilities endless
The above four ideas are only a fraction of what we can do with the online-based news literacy education and research. By taking advantage of the detailed behavioral data with a large sample size, researchers can now track down, aggregate, and investigate the varying patterns of news literacy skill acquisition. The implications and possible future directions of internet-based teaching and research are, I dare to say it, endless.
Ultimately, this kind of research could evolve into a computer modeling that pinpoints specific variables as predictors. We could measure the effectiveness of educational intervention in the field of news and media literacy and improve our teaching strategies accordingly, as our goals are to nurture the future generation of discerning media consumers who also produce and distribute content.
In today’s technologically interconnected societies, I believe the computer modeling would give great insight into the design of effective online pedagogy while presenting opportunities for news literacy scholars to test a multitude of pedagogical designs, teaching methods and research hypotheses in a large scale.